
On top of the core platform, BUILDSPACE will offer the following services to different building stakeholders and will provide analysis and decision support services for sustainable development and energy retrofitting in buildings at building and city scale. More specifically, the BUILDSPACE Services (SE) at building level supporting building construction, monitoring and renovation are:
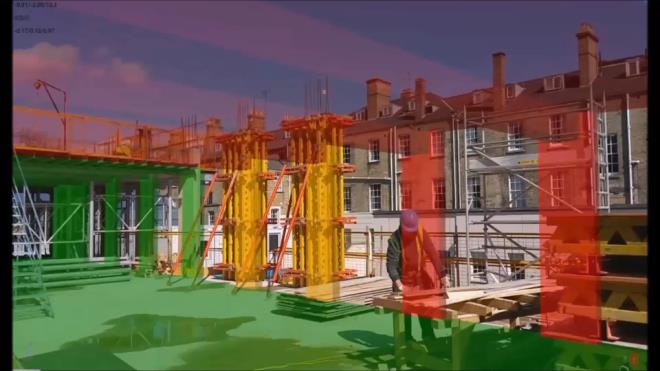 SE1. Digital Twin Generation
Service Description: This service will integrate methods for generating the geometry of Digital Twins of Buildings from locally sourced geometry data and will build the associated interfaces for human-information interaction between users and Digital Twins in mixed reality environments. The resulting DTs will be linked with EGNSS data for integration into city-scale models, and enable users to visualise the resulting DTs in mixed reality environments. This service will enable interactive screenuse, VR and AR interfaces for visualising DTs at construction site and 3D DT visualisation for existing buildings.
Use of EGNSS/Copernicus services: The service will link the resulting DTs with the Copernicus data (Sentinel 2 and 3 data and Land Cover). Spatial resolution of data is expected in 10m and data formats include GIS ESRI shape file (.SHP, .DBF, .SHX). EGNSS differentiators will be used to enable high precision mapping of the DT against the PT and allow high precision Augmented Reality based on-site visualisation of the design-intent version of the DT on the construction-phase PT. This service will expose a link to the resulting DTs and position them through EGNSS at city context enabling their “consumption” by the city-level apps to allow dynamic building monitoring at city scale.
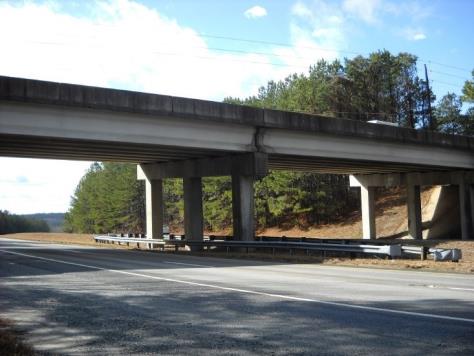
SE2. Digital Twins enrichment by combining UAV, thermography and SLAM approaches
Service Description: This service will enable the integration of Simultaneous Localisation and Mapping (SLAM) based approaches, Unmanned Aerial Vehicles (UAV) platforms and thermal analysis for Digital Twins enrichment for an advanced and accurate building energy performance assessment.
Use of EGNSS/Copernicus services: The service will link the resulting static combined dataset [XYZRGBT] with the Copernicus land data. EGNSS differentiators will be used to enable high precision mapping of the static combined dataset [XYZRGBT] against the Physical Twin (PT) and the Digital Twin (DT) and subsequently allow for the generation of high-fidelity multi-modal DTs. The resolution of the data will be around the centimetre as well as its accuracy. The format of the projects generated during this service will be universal formats such as .LAS, .LAZ or .e57 among others.
The BUILDSPACE Services (SE) at city level supporting buildings/buildings stock analysis, forecast and resilience to climate change and natural hazards are:
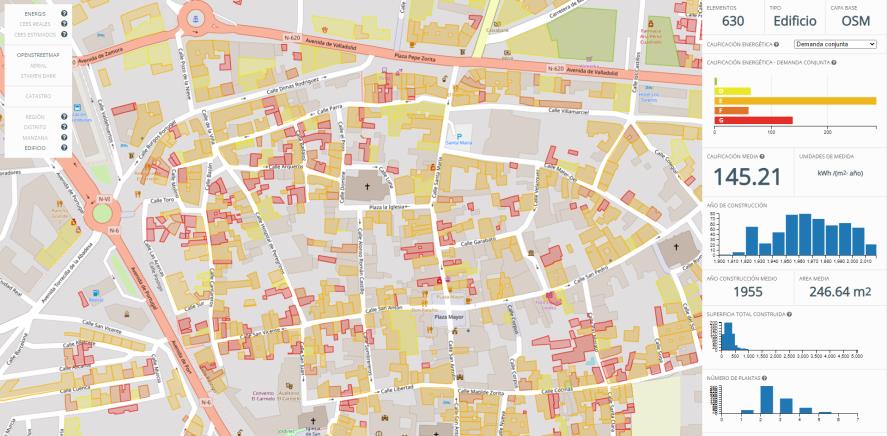 SE3. Building Environment Climate Scenarios
Service Description: This service will support urban stakeholders (e.g. urban planners, real estate and construction companies) in understanding how the building stock energy demand will be affected in the future by climate change. The service will rely on forecast of energy demand according to the standard accepted CMIP 6 scenarios (SSPs- RCPs) trough downscaling the climate data and calibrating them with historical data from weather stations. Results from CMIP6 existing models (e.g. BCC-CSM2-MR, MRI-ESM2-0 and NorESM2-MM) at 100 x100 km of spatial resolution will be used to obtain high-resolution datasets (up to 100m) at local scale.
Use of EGNSS/Copernicus services: This service will make use of Copernicus data from:
1) Copernicus Climate Change service, in particular, concerning the urban climate using C3S ERA5-Land climate reanalysis data16 and E-OBS in-situ observations gridded observations17, to calibrate future climate variables project from both real and/or simulate past data,
2) Copernicus Land service, concerning the Urban Atlas data, in particular Sentinel 1-2 images together with LiDAR data (when available) will be used for building stock geometry automatic generation to complement other potential data sources such as Open Street Maps. Machine Learning techniques (e.g. computational neural networks (CNN)) will be used for an automatic classification of images and elements identification (e.g. boundaries, roofs, shadowing, etc.), and
3) Copernicus Atmosphere service, concerning radiation and cloudiness will be applied for an accurate energy demand estimation of the building stock. In addition to this, it will explore data from the Sentinel hub or Sentinel 1 to achieve higher spatial resolutions if needed.
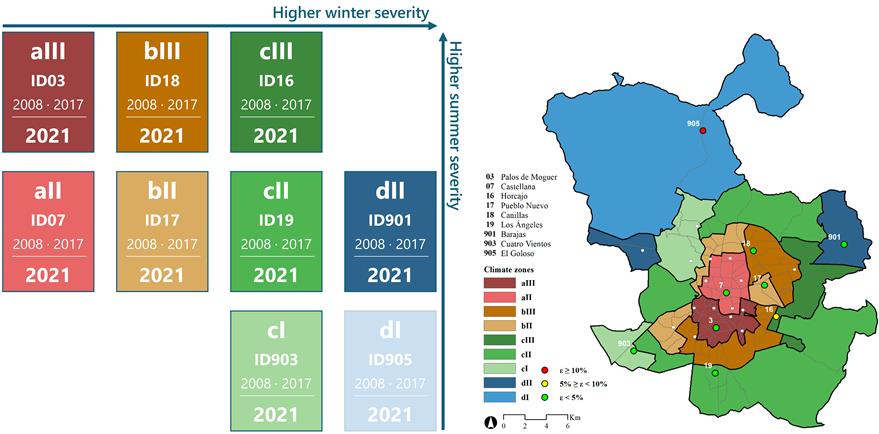 SE4. Urban Heat Analysis and Resilience
Service Description: This service will analyse urban heat at high resolution and will combine demographic data to calculate the so-called urban heat risk and assess social vulnerability to heat. The service will combine the high-resolution urban heat analysis with socio-economic and demography data to evaluate the impact of Urban Heat Island (UHI) and other microclimatic phenomena on the energy performance of buildings. The service will incorporate a decision support service that will guide urban stakeholders' adaptation and mitigation strategies to climate change at building-neighbourhood scales.
Use of EGNSS/Copernicus services: The service will make use of Copernicus data from the Climate Change service, in particular concerning the urban climate model UrbClim, based on C3S ERA5 observed variables, and which provides hourly climatic data with a horizontal resolution of 100 m18. This service will also rely on Copernicus data from its Land Monitoring service, particulary the Urban Atlas19, as well as on the socioeconomic statistics from Eurostat’s Urban Audit20. In addition, it will take advantage of urban climate georeferenced classification tools, such as the WUDAPT initiative21,22, which are based on Sentinel-1 and Sentinel-2 datasets, and which will facilitate intercomparability between pilots and other urban environments. For the implementation of the “Social Vulnerability to Heat” of ground and satellite (Sentinel 3) data on air temperature and land surface temperature respectively will be used. Satellite data will be downscaled to 100 m x 100 m (from 1 km x 1 km) and will be related to air temperature by means of a parametric formula as devised for the pilot area. Collateral data to be considered will be: land cover and its changes over time (with the use of Sentinel-2 data), population and urban density, presence of hot spots, urban greenery distribution, buildings’ state (as to its thermal insulation), spatial distribution of vulnerable groups (<14 years old and > 65 years old), critical infrastructures (e.g. hospitals, schools, etc.). Results will allow the design of measures to reduce the vulnerability of city dwellers to heat and protect people at risk. The service will make use of Copernicus data, such as Land: Sentinel 2 and 3 data and Land Cover and Land Cover changes service, Vegetarion, LST. Climate Change: Climate Data Storage Toolbox, Daily statistics calculated from ERA5 data, European temperature statistics derived from climate projections, Heat wave days for Europe derived from ERA5 reanalysis, Heat wave days and heat related mortality for nine European cities derived from climate projections
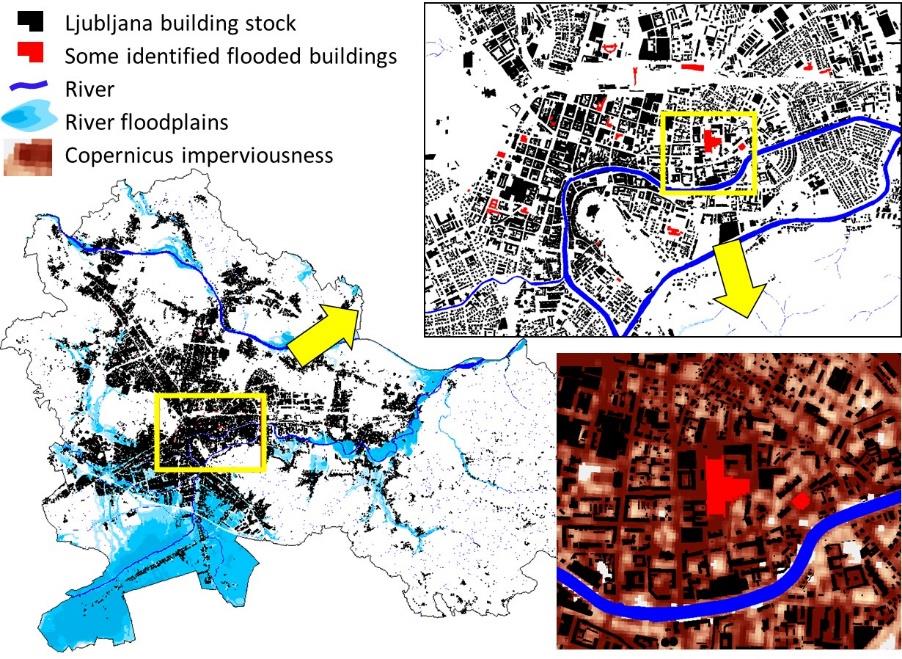 SE5. Urban Flood Resilience
Service Description: This service will combine Copernicus data and available public or city data (buildings, green areas, identified green roofs and facades) and systematic measurements of temperature, humidity, and rain amounts (for at least one year) to increase building resilience to flood damages in urban environments. In addition, the service will provide a decision support tool providing condition instructions for building renovations and blue-green infrastructure design and implementation to increase building resilience.
Use of EGNSS/Copernicus services: The service will make use of Copernicus data Copernicus data from the Land service and Climate Change services like 1) high-resolution imperviousness degree produced by semi-automated classification, based on calibrated normalised difference vegetation index (NDVI) with resolution 10x10m, 2) surface temperature and evaporation with resolution 100x100m and 3) land cover maps based on SENTINEL Satellite imagery with 10x10m spatial resolution and validated with a sample of in-situ measurements and observations of imperviousness, temperature, and humidity.
